
Version 5.8 - Released Dec 10, 2015
The Sales Cycle Report - All Traffic report allows you to view your traffic, check close rates, verify sales steps are being completed for any time frame you prefer. After choosing your date range options and the sorting option (all nine options are listed below) you can either Run Report or Email Report.
NEW - Version 6.1 – Released April 14, 2016
An Admin user can now select the order in which the Traffic Types will display on the Sales Cycle Report-All Traffic in Showroom Configuration > Traffic Types.
We have the following nine (9) viewing options:
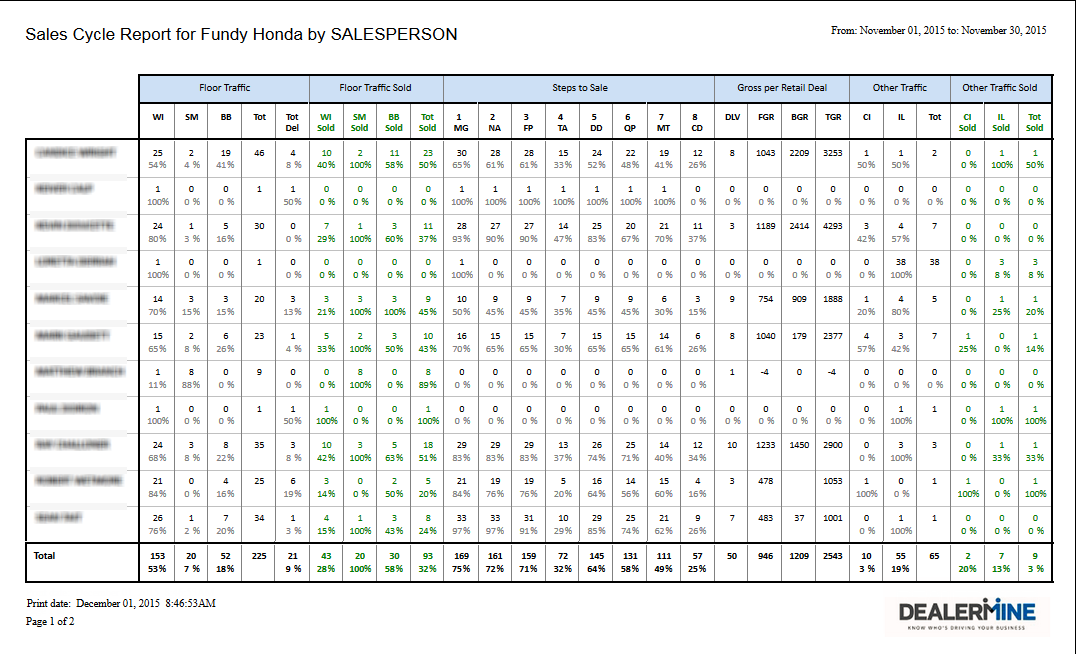
1. Salesperson
Each Salesperson will be listed in alphabetical order by first name, showing their data for the time frame being reported on in the following sections:
Floor Traffic
Traffic Types flagged as Floor Traffic in Showroom Configuration will appear in this section of the report, meaning these types of Traffic are consider 'true floor traffic'.
Total and Total Deleted will be displayed
Floor Traffic Sold
Sold counts and percentages for each Traffic Type
Total Sold for Floor Traffic
Steps to Sale
Abbreviations of each Sales Step, measuring sales steps completed on Floor Traffic only
Gross per Retail Deal
Delivered
Front end Gross
Back end Gross
Total Gross
Other Traffic
All remaining Traffic Types that are not flagged as Floor Traffic will appear here abbreviated.
Total sold for all other traffic
Other Traffic Sold
Sold counts and percentages for each Traffic Type not flagged as Floor
Total Sold for Other Traffic
2. Department
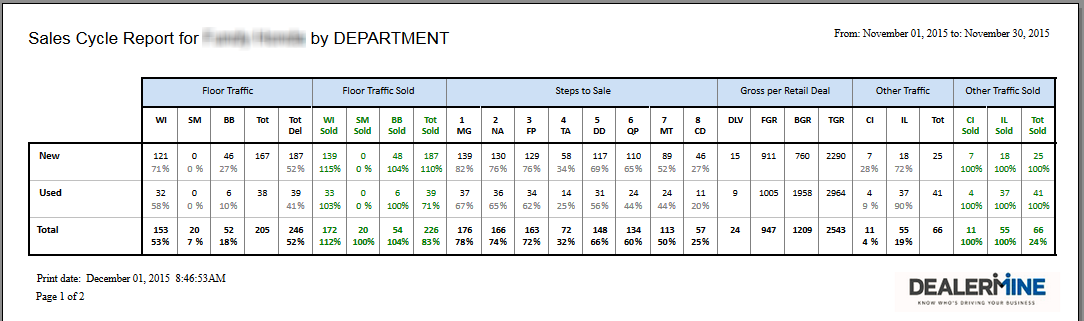
All columns are the same as listed above.
Departments are properly configured in Showroom Configuration > Departments where sales types must be linked to New or Used. This will help keep your report accurate when running it by department.
3. Model
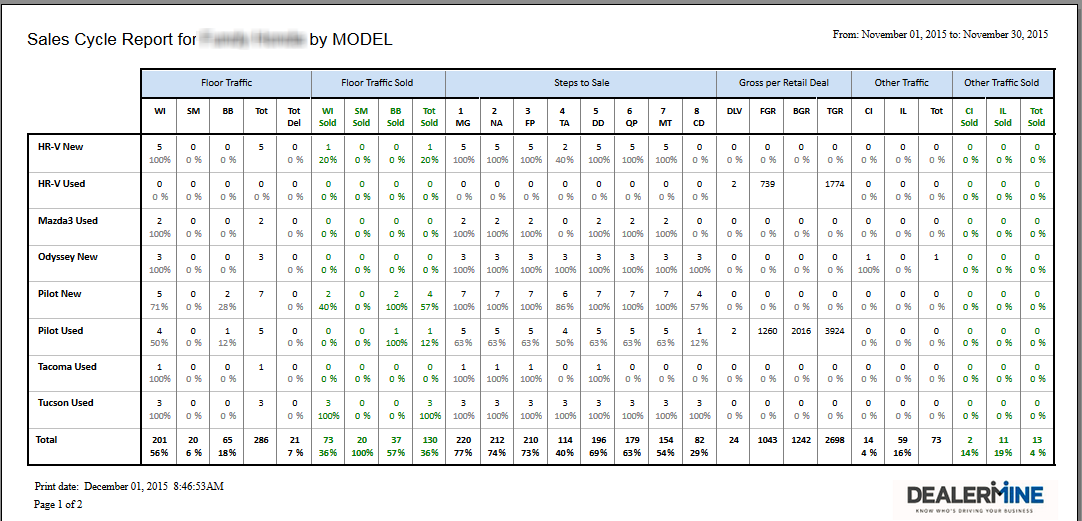
All columns are the same as listed above but will give you a comparison by model.
4. Month
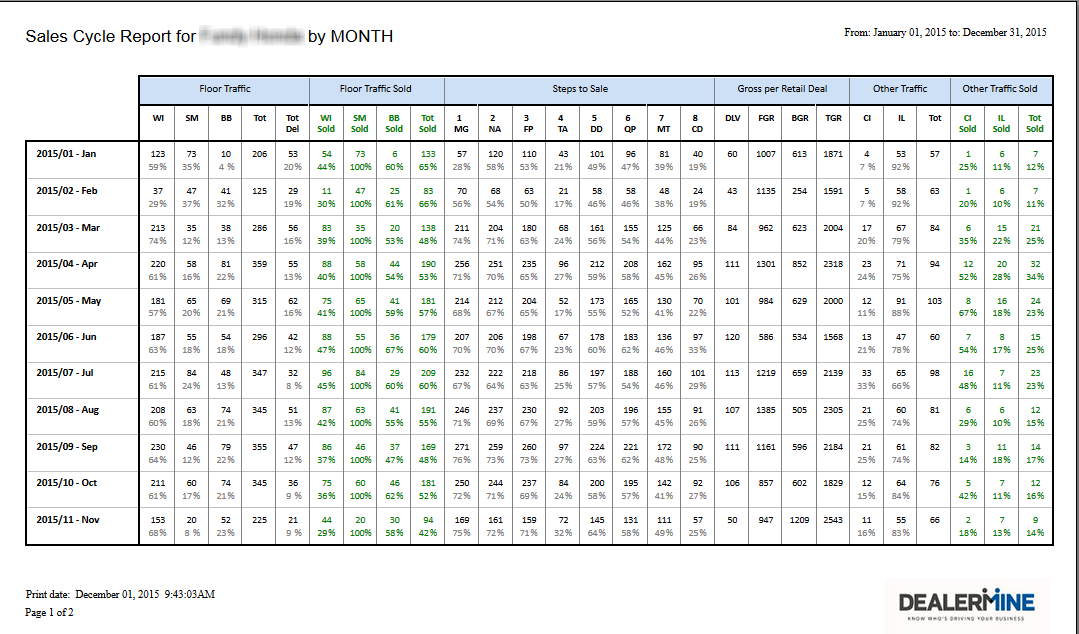
All columns are the same as listed above but will give you a comparison by month over month for the time frame you're reporting on. A 12-month range is recommended.
5. Year
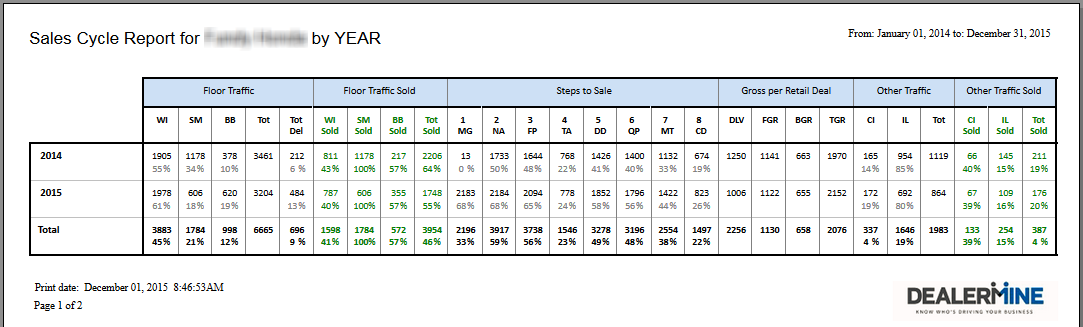
All columns are the same as listed above but will give you a comparison by year over year for the time frame you're reporting on.
6. Media
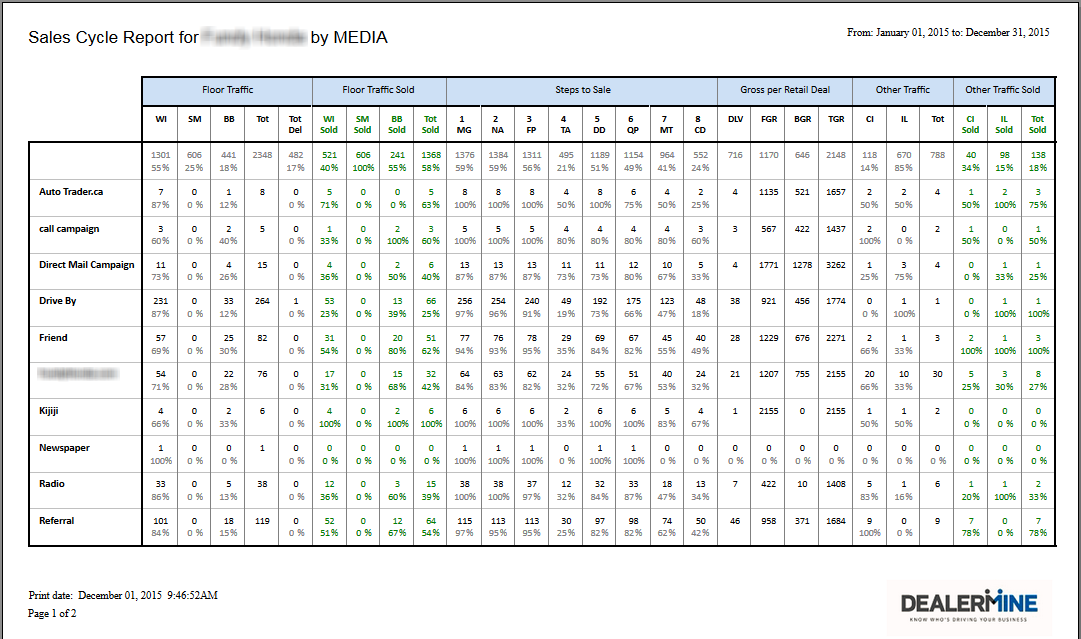
All columns are the same as listed above but will give you a comparison by media source.
7. Desk Manager
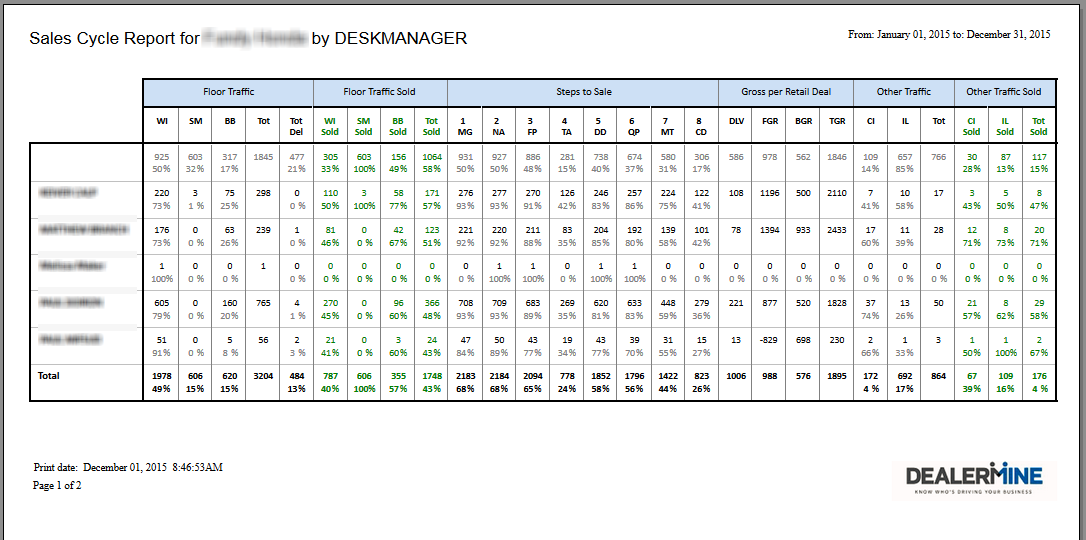
All columns are the same as listed above but will give you a comparison by Desk Manager assigned on each Traffic Log entry.
8. Entered By
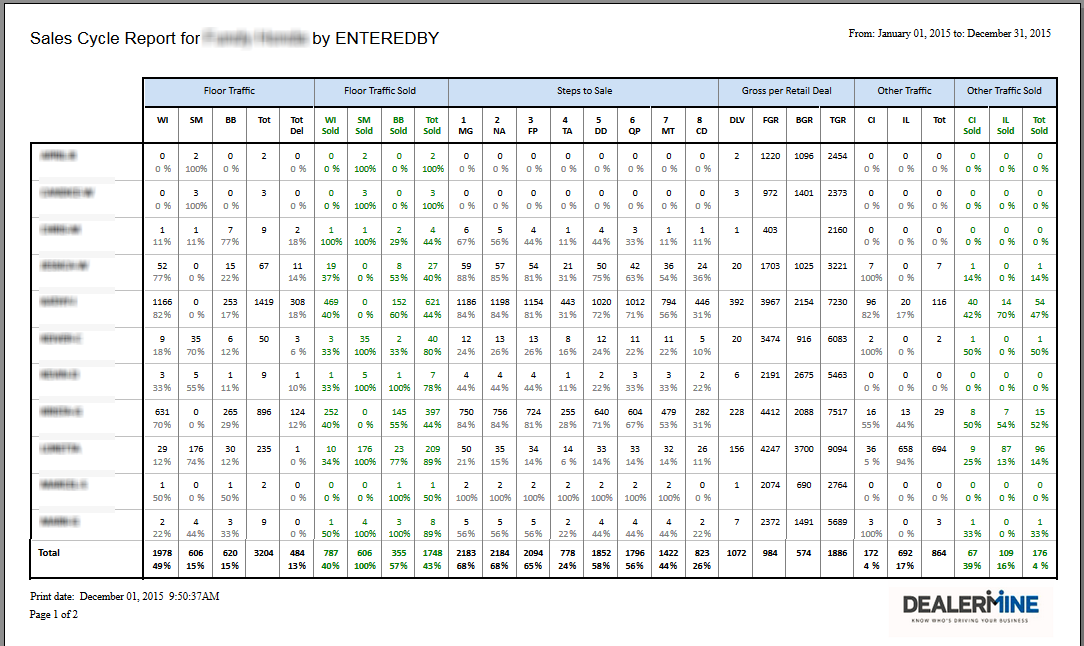
All columns are the same as listed above but will give you a comparison by the user who initially entered it on the Traffic Log.
NEW - Version 6.7 – Released Nov 3rd, 2016
9. Sales Team
All columns are the same as listed above but will give you a comparison by Sales Teams assigned on each Traffic Log entry.
Note: Sales Teams must first be setup in order for proper data to populate on this report.